https://community.grafana.com/t/state-timeline-how-to-not-display-the-metric-names/54529
The trick is to use https://unicode-explorer.com/c/007F
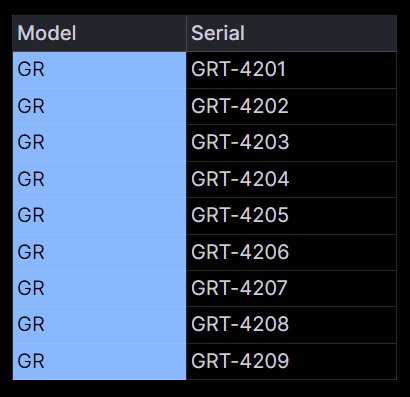
The Dynamic Text Plugin is amazing! I wanted to know how to loop through, put data into a table, and also color code the column.
First, a SQL statement brings in some data.
Next, html.
<!DOCTYPE html>
<html>

<head>
  <style>
    .custom-table {
      font-size: 40px;
      width: 100%;
      border-collapse: collapse;
    }

    .custom-table,
    .custom-table th,
    .custom-table td {
      border: 1px solid black;
      text-align: left;
    }

    .custom-table th,
    .custom-table td {
      padding: 8px;
    }

    .custom-table td:nth-child(1),
    .custom-table th:nth-child(1) {
      padding-right: 50px;
    }

    /* Ensure .status-div is defined if used inside td for additional styling */
    .status-div {
      color: black;
      /* Sets font color to black */
      width: 100%;
      height: 100%;
    }
  </style>
</head>

<body>
  <table class="custom-table">
    <thead>
      <tr>
        <th>Model</th>
        <th>Serial</th>
      </tr>
    </thead>
    <tbody>
      {{#each data.[0]}}
      <tr>
        <td style="background-color: {{statusColor}}">
          <div class="status-div">{{model_name}}</div>
        </td>
        <td>{{erp_pco_serial_number}}</td>
      </tr>
      {{/each}}
    </tbody>
  </table>
</body>

</html>
The each data.[0] loops the data
The handle bar syntax {{model_name}} matches the fields in the sql query
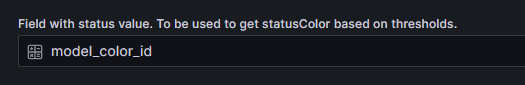
The cool thing about the Dynamic Text is they included a statusColor variable https://volkovlabs.io/blog/dynamictext-panel-4.1.0-20230731/
This allows you to assign a field to the statusColor
Then you can set the color using the built in grafana thresholds!
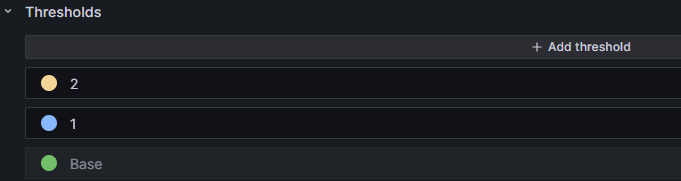
That allows you to use it inside the graph like this