So if you are following along, we have some tag data flowing from the first part https://michaelellerbeck.com/2020/02/14/tulip-co-opc-ua-simulator-quickstart/
Now let’s do some stuff with it.
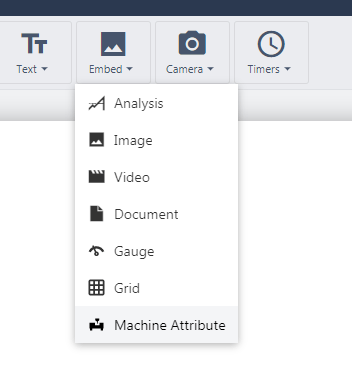
First fire up an app
Edit your master layout
At the top choose embed, Machine Attribute
Now, on the right choose your machine and attribute
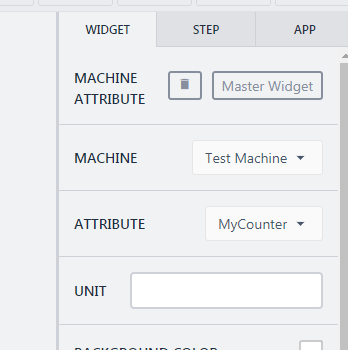
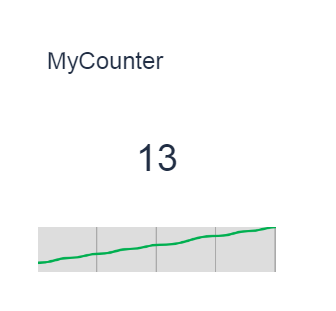
Now you should see some data flowing into the widget.
Now, in order to get the data actually recorded you need to ‘complete the app’
https://support.tulip.co/en/articles/2294670-how-to-complete-an-app
We want it to be automatic so let’s do it through a trigger
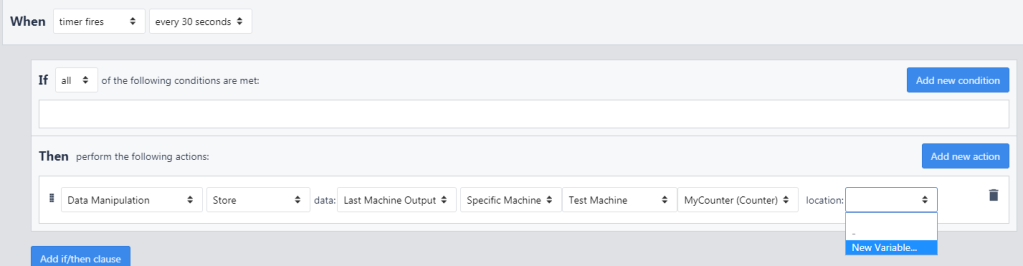
The trigger will happen every 30 seconds. Then it will do some ‘data manipulation’
It will store the last machine output of our test machine and it will store the counter into a New Variable (Go ahead and give it a name)
Then underneath add an App / Complete App

Also, add a menu button. Always add a menu button!
Hit Run on the App, it will open up in the Tulip Player
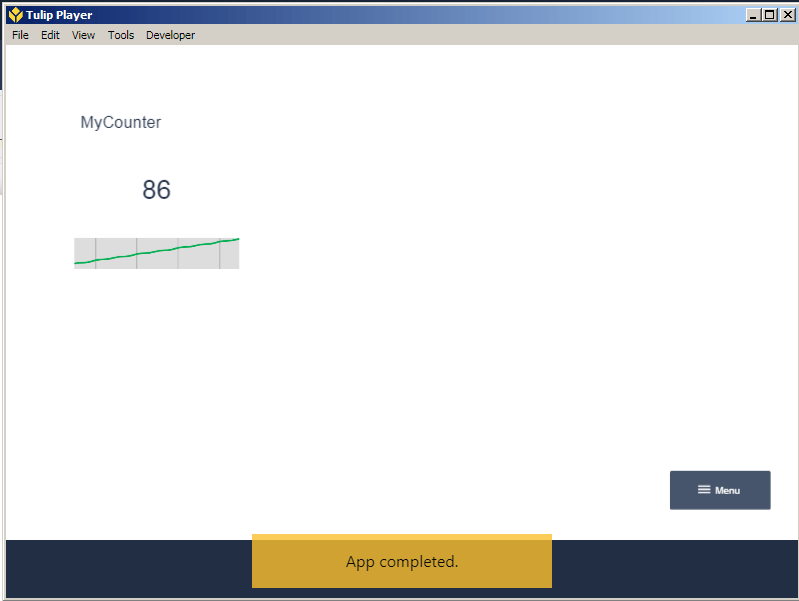
If you wait for a while you should see ‘App Completed’ pop up.
That let’s you know that it wrote out your variable to the app DB
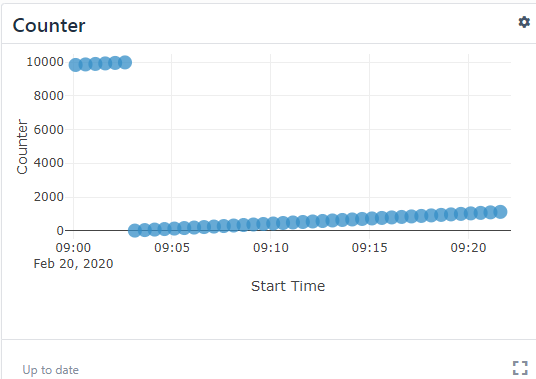
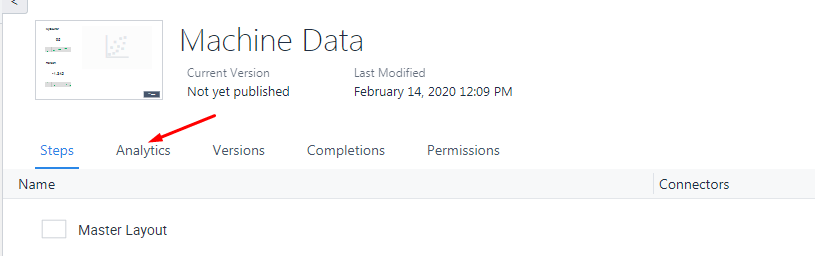
Ok, now you can make an ‘Analysis’, if you click on your app then go to Analytics
Click Add Analysis, and choose a scatter plot, so far its the closest I’ve seen to a real-time chart
Set the X AXIS to End Time (this is when the complete app process fires, every 30 seconds in this app)
Set the Y AXIS to Counter (our variable we made)
Compare by (delete it)
Data range – This one is interesting, to get the last hour of data change it to Relative: All Dates After and the I put in 1 hours ago
The last thing I change is under sharing, change the Refresh Seconds to 5 (cause I’m impatient, and because this setting changes the refresh of the chart everywhere)