One really cool plugin for Grafana is the FlowCharting Panel. https://grafana.com/grafana/plugins/agenty-flowcharting-panel/
One easy way to define it is to make ‘live’ draw.io diagrams.
https://www.factry.io/blog/tutorial-using-the-grafana-flowchart-plugin-to-create-a-process-diagram/
(This is just another blog doing some similar stuff)
Follow along for my noodling.
First get ye to some docker.
To have some data to query lets spin up a postgres container (https://hevodata.com/learn/docker-postgresql/)
docker pull postgres
docker run --name postgresql -e POSTGRES_USER=myusername -e POSTGRES_PASSWORD=mypassword -p 5432:5432 -v /data:/var/lib/postgresql/data -d postgres
I went with easy defaults.
Now that postgres is running lets grab its ip address
docker inspect -f ‘{{range.NetworkSettings.Networks}}{{.IPAddress}}{{end}}’ postgresql
Record that for use later -> In my case 172.17.0.2
Next fire up grafana with the flowchart plugin
Docker pull grafana/Grafana-oss
docker run -d -p 3000:3000 –name=grafana -e “GF_INSTALL_PLUGINS=agenty-flowcharting-panel” grafana/grafana-oss
—
Let’s create a simple table for some playing
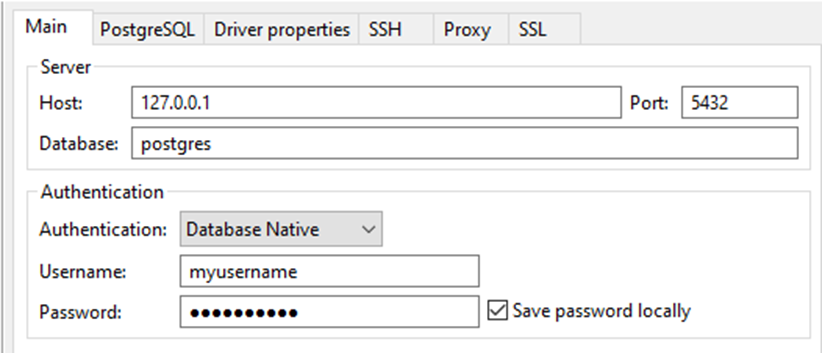
Fire up dbeaver or some other sql tool and sign into local host port 5432 with myusername and myuserpassword
CREATE TABLE public.robotevents (
eventid int8 NOT NULL GENERATED BY DEFAULT AS IDENTITY,
eventtypeid int4 NOT NULL,
eventvalue int4 NOT NULL,
createdon timestamptz NOT NULL
);
So we are going to pretend we have a little robot that goes around a factory and stops in four places. When it gets to location 1 it is going to write an event type id of 1. At second 2 and so forth
insert into public.robotevents (eventtypeid,eventvalue,createdon) values (1,20,now())
—
Ok, navigate to http://localhost:3000/ and you should see the grafana login
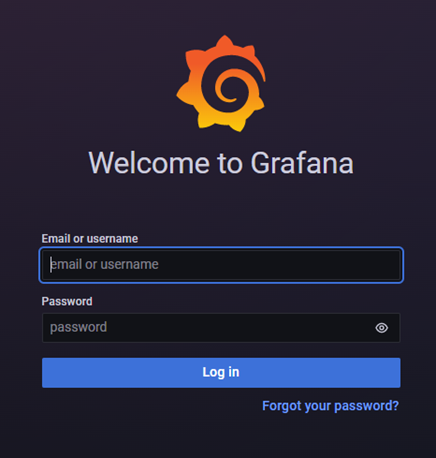
Login with admin, admin
Ok, we need to first connect a datasource. Go to configuration, datasources, and add PostgresSQL
Use the host ip that we retrieved up above from docker for the postgres container
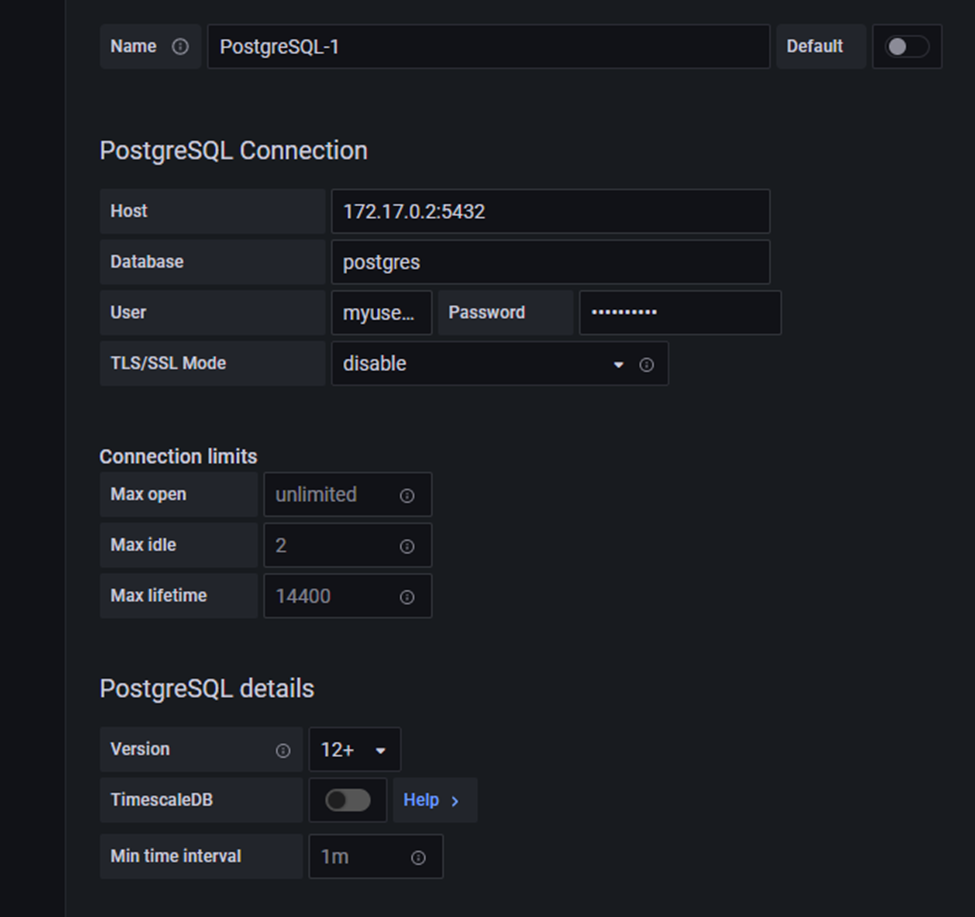
Press Save and Test and you should get

Next, lets make a new dashboard
Then we want to edit the query options like below

Then hit the Edit SQL so we can modify the sql a bit
I’m converting it to text so that we can use a comparison on it in the flowchart plugin
SELECT
createdon AS “time”,
eventtypeid::text eventstring
FROM robotevents
WHERE
$__timeFilter(createdon)
ORDER BY 1
Then change your viz to FlowCharting

It opens with a default draw.io image, lets edit it and create our own. Click Edit Draw

I delete the default stuff and then copy an image of a ‘shop floor’
I then create four squares to represent the four positions the robot can be in

Now for the mapping. Edit the created rule, and name it 1
In apply to metrics if you delete everything there it gives you a picklist, choose event string. Change the type to string change the pattern to 1

Now scroll down to Event/Animation Mappings
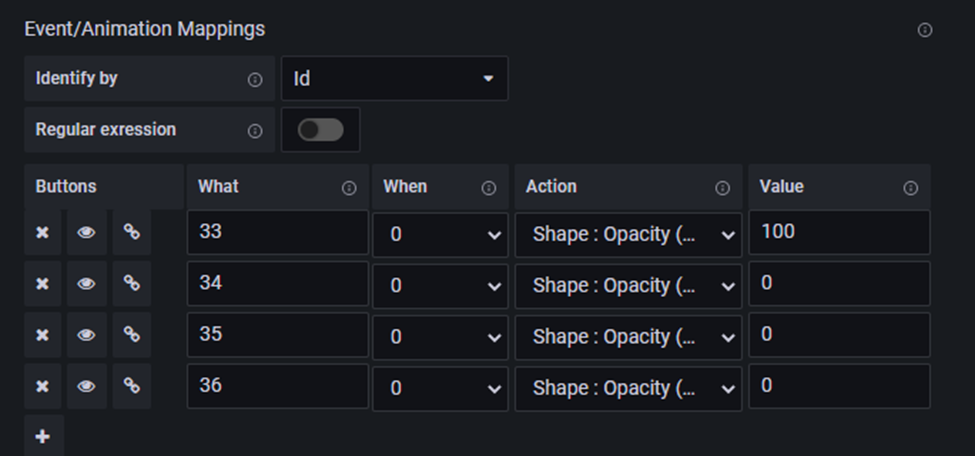
Create the first event, click the sidewise 8 link button and choose your first square (this helps you identify the id of objects)
The When in this case is When Level 0 which is set up above for a pattern match of 1
So when Level 0 occurs and a pattern match of 1
This basically will turn the square (id of 33) 100 Opacity and the others squares off.
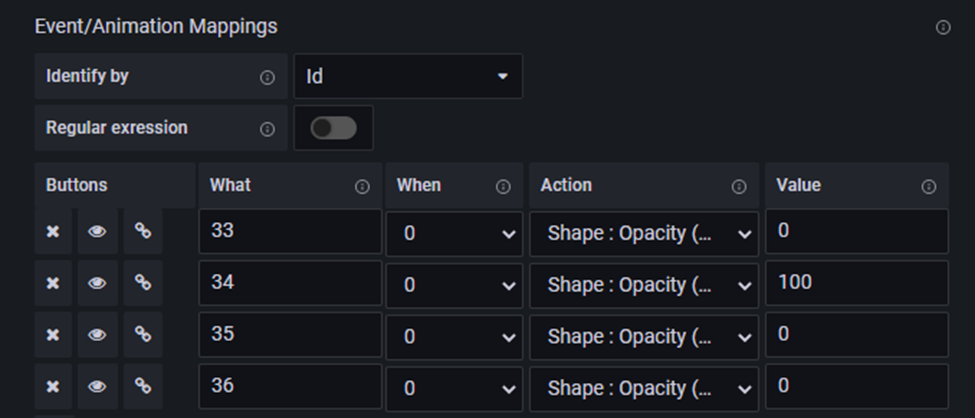
Clone this rule and name it 2 and use the down arrow to have it occur after 1
Change the threshold to 2
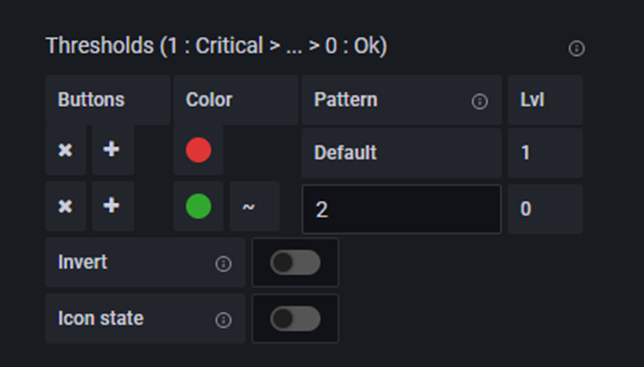
And modify the on and off logic so that the 2nd square is visible and the others and invisible.
Hit save and apply.
Also, reload the entire screen of the dashboard (it seems to need a hardreload to register changes)
Do this again for 3 and 4.
Now you can send eventtypeid’s of 1,2,3,4 and watch as the dashboard moves the square around.
insert into public.robotevents (eventtypeid,eventvalue,createdon) values (2,20,now())
Tada, your robot friend moves around

